[Home]
[XOpropagation] [Circular Polarized TX Antenna Challenge]
Circular and elliptical polarisation and propagation on shortwave
Tks to Eric, KL7AJ, I got interested again in the effect of circular polarisation on shortwave.
See: QST December 2010, "Gimme an X, Gimme an O", by Eric Nichols KL7AJ
I agree with Eric, that the ham radio community wrongly has neglected these aspects of the propagation.
I used the eXtraordinary/Ordinary elliptical polarization behavior of signals already for man-made noise reduction in: “Effective Directivity for Shortwave Reception by DSP”, QEX July/Aug. 2006, pp 37-45.
After building the polarization measurement setup and doing some measurements I needed to make an overview for myself.
In the EXCEL sheets I have summarized the different aspects, consequences and conclusions as far as I have learned until now. I am not a specialist on this field, so please read it as such.
The following topics are discussed in the sheets:
- Introduction to X and O (Extraordinary and Ordinary Mode Propagation)
- Calculation of polarization by summing X and O
- Calculation of ellipticity and orientation
- Basics Frequency Selective Fading (FSF) and Multipath Propagation over an Ionospheric - Path
- Frequency Dependent Polarization (FDP) and Frequency Dependent Polarisation Mismatch (FDPM)
- Polarization Diversity and Signal to Noise ratio
- Using single antennas and FDP
- Using intended or unintended circular polarized antennas
- Measuring setup using 2 K2's and DSP
- Measuring results examples
More info on NVIS and polarization on shortwave
A very interesting and thorough research on the subject is going on by Ben A. Witvliet (PE5B ex. PA5BW) et al. I strongly recommend reading his thesis, because it is all about NVIS:
Thesis: Near Vertical Incidence Skywave Interaction of Antenna and Propagation Mechanism
In the past they also did measurements on NVIS propagation:
QST, January 2006, “Elevation Measurements During a Local Contest”, pg 28-30, by PA3DES, PA5BW, PA0SIR, PA0A.
A very good overview of NVIS is reported by Ben A. Witvliet and Rosa Ma Alsina-Pagès:
Radio communication via Near Vertical Incidence Skywave propagation: an overview
I also recommend reading NM7M’s book on:
NM7M The Big Gun's Guide to Low-Band Propagation
NVIS measurements on 80m
The hardware used for the measurement:
2 phase coherent Elecraft K2 receivers (down conversion to audio)
2 small orthogonal active receiving loop antennas (1.33 by 1.33 meters)
The digital signal processing is programmed
in Matlab/Simulink.
See also the EXCEL sheets.
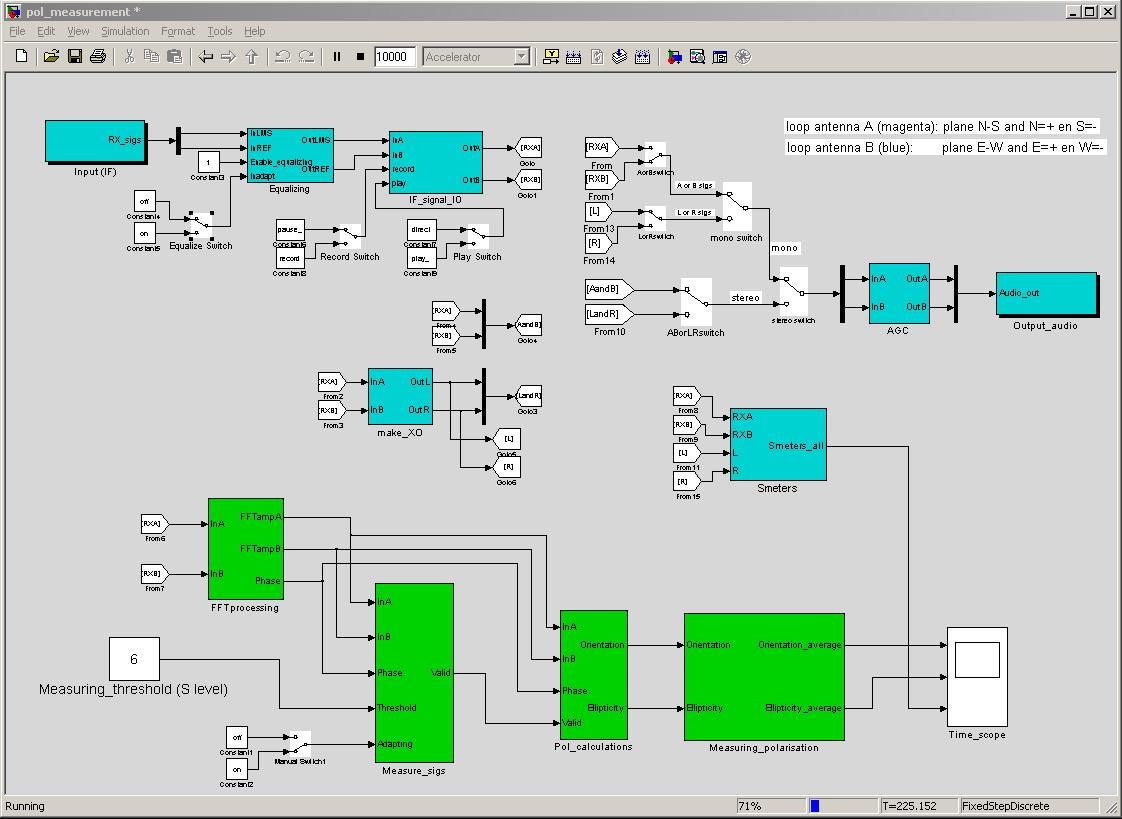
Fig.1. Screenshot of the Simulink model top level.
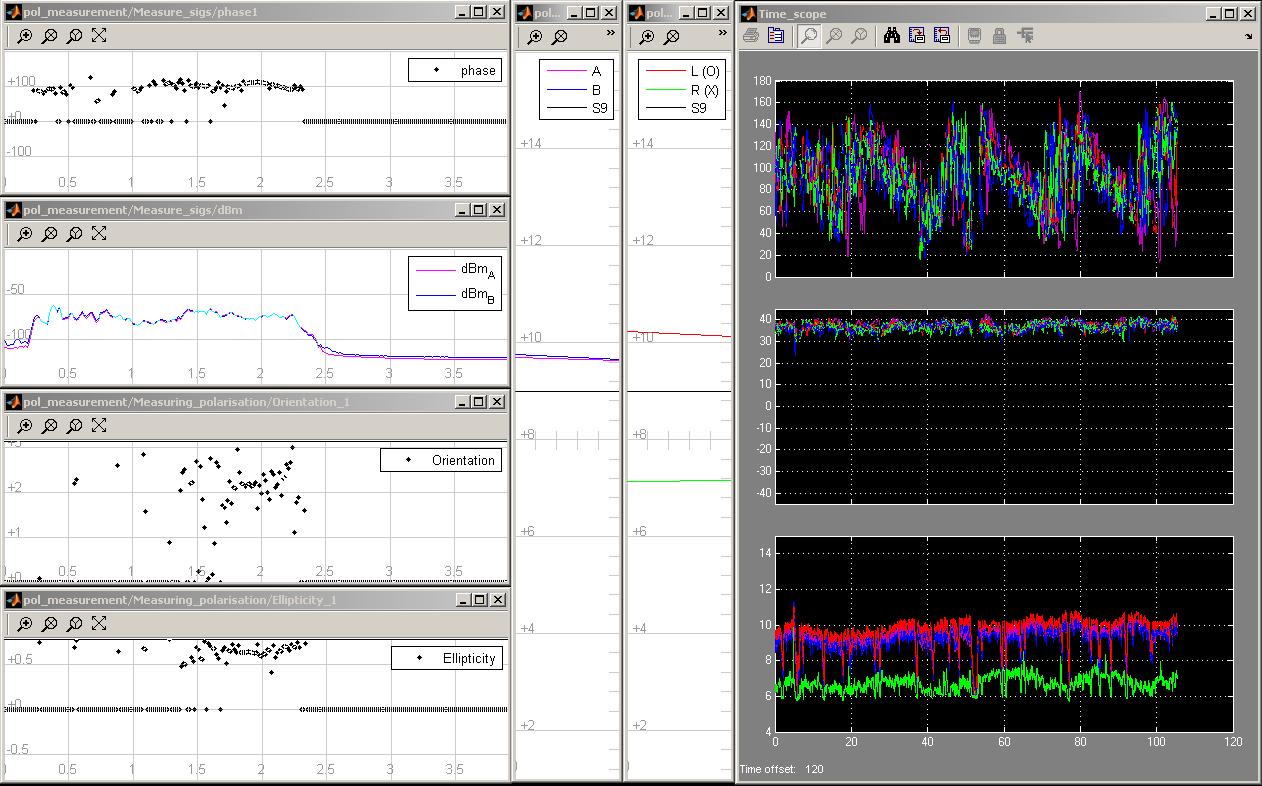
Fig.2. Screenshot of the measurement results on 80mtr.
On the left are the “real-time” results in the frequency domain (0-4kHz).
Top to bottom: phase difference, amplitude, orientation and ellipticity.
On the right (black scopes) are the results over time (seconds).
Top to bottom: orientation, ellipticity and the signal levels of both antennas A and B and of the Left and Right hand circular components.
In between are the two S-meters for the antenna signal levels of antenna A (magenta) and B (blue) and of the Left (red) and Right (green) hand circular components. The levels are in 6dB S-points.
The measurements shown are typical (February 2012) for 80m NVIS communication during day-time (in PA-land, magnetic inclination about 60°).
The ellipticity shows almost full circular numbers, so these NVIS signals are practically circular polarized.
That is why the orientation is noisy. However the drift (delay between X and O) is still visible.
The level of the Left (O) hand circular component is 3dB higher than the signal levels of the antennas A and B. The Left (O) hand circular component is very dominant. The signal level of the Right (X) hand circular component is 24dB lower than that of the Left (O) hand circular component. This is not unusual, 12-24dB is common during day time.
The corresponding ionogram (thanks Belgian Dourbes) is:
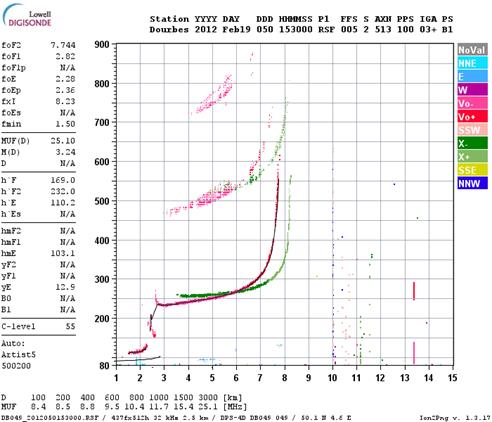
The Extraordinary wave (green trace), the Right hand circular component, is heavily attenuated on 80m. Only the Ordinary wave (red), the Left hand circular component, is present. Because the NVIS signals are never exactly vertical, a somewhat lower effective frequency must be selected.
Drift becomes better visible when both the Left (O) hand and the Right (X) hand signals have comparable levels.
Frequency Dependent Polarization becomes also possible.
See the examples below.
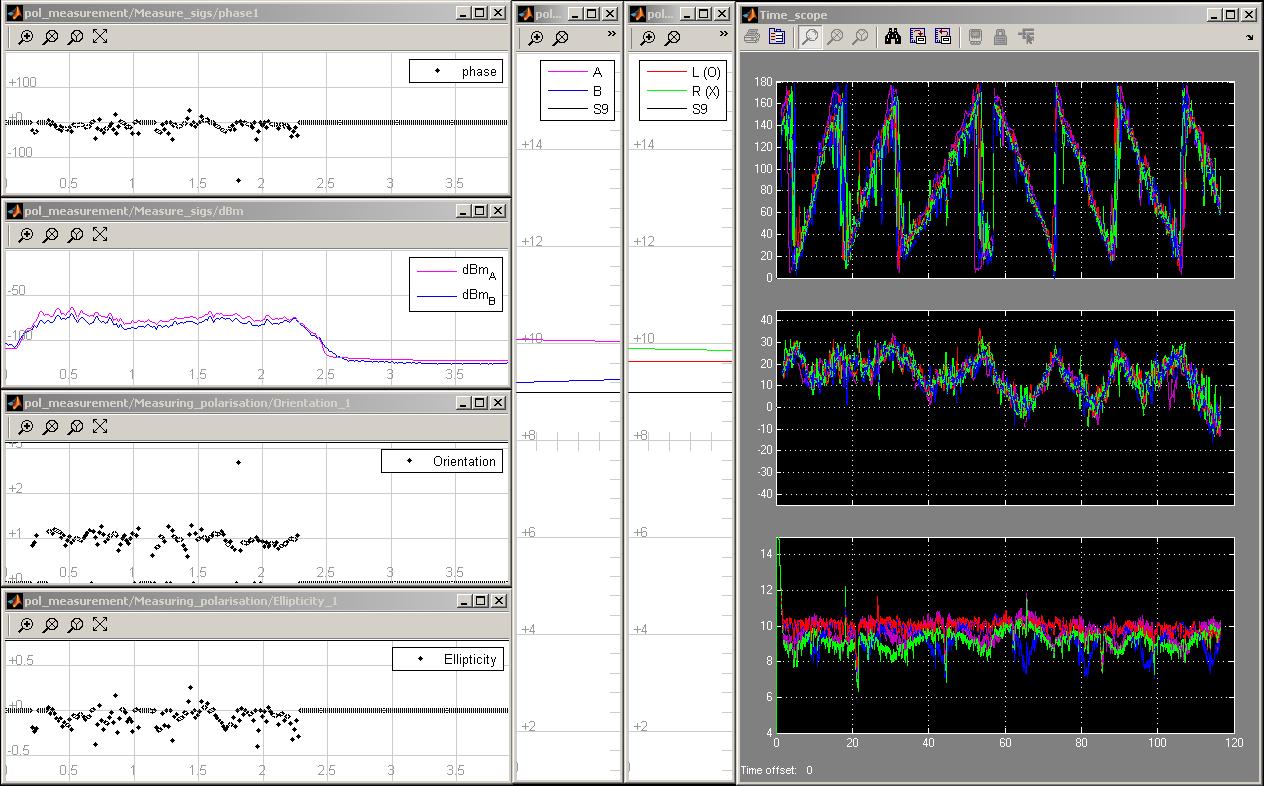
Fig.3. Drift in orientation on 80mtr.
Now the X mode is also present, ellipticity is around zero, phase difference around zero or 180 degrees.
Second half of the plot (black scopes) shows the signal of the same station, but 15 minutes later. The orientation rotates in the opposite direction.
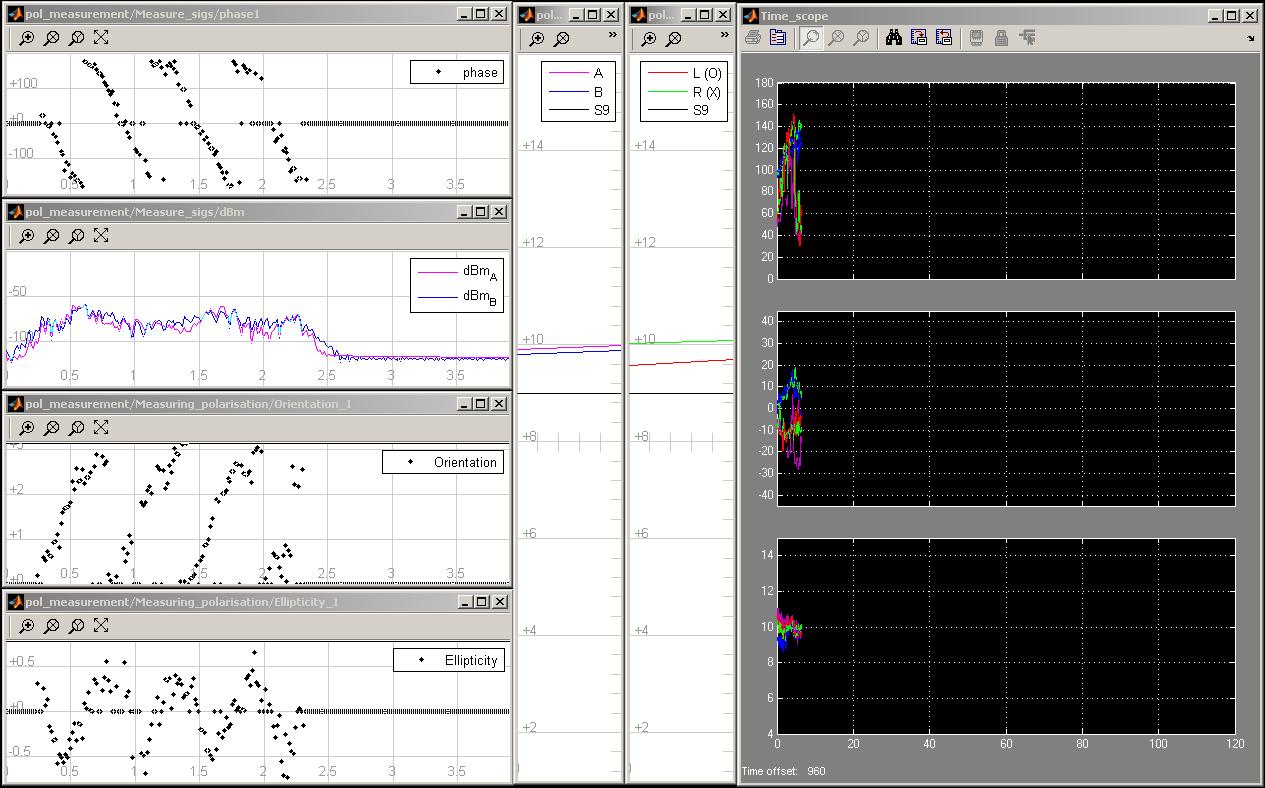
Fig.4. Frequency Dependent Polarization on 80mtr.
FDP is beautiful plotted in the Phase, Amplitude, Orientation and Ellipticity.
The corresponding ionogram (Fig.3 and 4) is:

What can be observed in the 80m NVIS results?
- during day time ellipticity shows almost full circular numbers, so NVIS signals are practically circular polarized (in PA-land, magnetic inclination about 60°). This also applies to QRN from lightning at NVIS distances.
- the O mode is practically always present and stable, independent of the presence of the X mode (except occasionally during night time)
- the linear polarized antenna signals A and B show the FDP/FSF and qsb/fading
- the Left hand (O) circular antenna signal (red) is 0-3dB stronger and stable
- when the X mode comes up, the orientation will drift and rotate, causing qsb/fading (indicating a drifting delay/altitude between X and O)
- when the X mode comes up, FDP becomes possible causing Frequency Selective Fading (indicating a large delay difference**)
- the foF2 critical frequency can go very low and only the X mode can be present at 80m
- if the foF2 is low DX signals and NVIS signals can show opposite polarizations
- sporadic E: both modes are present
So in short:
- using circular polarized TX and/or RX antennas reduce:
- drift in orientation and so qsb/fading
- Frequency Dependent Polarization and so Frequency Selective Fading **
- using circular polarized RX antennas improve signal to noise ratio up to 3dB
- using circular polarized TX antennas improve the signal strength up to 3dB
See for more detail the sheet SN-diversity.
** Multiple reflections, as can be seen on the ionogram, is a type of Multipath Propagation with large delay differences. This delay difference can be between X and O, but also between multiple reflections of the X/O combination. This results in Frequency Dependent Polarization.
When using circular polarized antennas, Multipath Propagation of the O or X wave individually, remains possible and still can cause Frequency Selective Fading (sheet FSF).
But this fading is not as deep as with linear polarized antennas.
A quick calculation: the Frequency Dependent Polarization shows a periodicity of 600Hz (fig.4), indicating a 1.67msec round-trip delay, equals 500km distance, equals 250km altitude.
This is sufficiently close to the altitudes shown in the ionogram.
I was very pleased to find the report of Bob, WA3WDR (SK), on his experiences and detailed observations using a circular polarized antenna on 75 meters:
http://web.archive.org/web/20130905114615/http://www.bruhns.us/CP_on_HF/CP_on_HF.html
This fully agrees with the measurements.
Bob’s very interesting report is the only one I could find on the internet.
It seems that only a very few hams have experimented with circular polarization on HF.
Bob told me that there seems to be one shortwave broadcaster using a circular-polarized transmit antenna (may be WE2XRH).
Circular polarized RX antennas are certainly doable.
The real challenge of course is how to construct a controlled circular polarized transmit antenna on 80 meters.
[up]
Last update: January 12, 2019
© PA0SIM